GPU at 100% Usage at Idle? Which Process Is Using Your Graphics Card — Hardware Acceleration, Background Apps & Miner Malware Diagnosis Guide
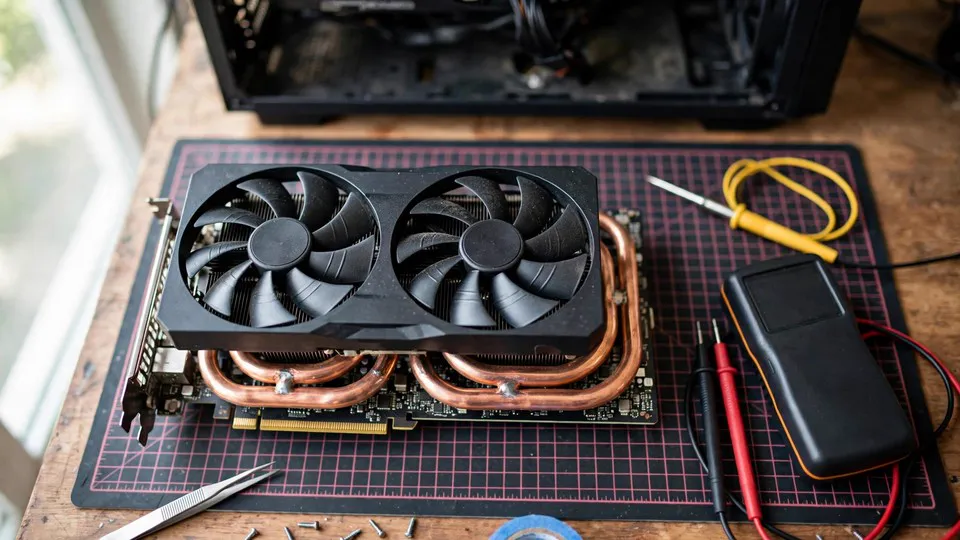
Key Summary
A graphics card showing high usage while the computer sits idle is usually a question of which program is asking it to work, not a sign the card is failing. This guide separates five suspicion layers — programs, the window manager, settings, drivers, and malware — and walks through seven steps to find the program responsible.
What This Problem Is — and What It Is Not
Picture the scene: the computer is sitting at the desktop. No game is open, no video is rendering, no heavy application is running. Yet Task Manager shows the graphics card at 30%, or even 100% usage. The fans spin up loudly, the temperature climbs, and the card behaves as though it is in the middle of a demanding game while nothing is happening on screen.
That scene is the problem this guide covers, and the first thing to establish is the shape of the symptom, because the shape decides everything that follows. Four conditions must all be true before the steps below apply:
- The computer is genuinely at idle. No game, video editor, 3D program, or video call is open. The desktop is showing, and at most a browser or a chat application is sitting in the background.
- The high usage stays high. It is not a brief spike that appears for a second and falls away again. It holds for minutes, or for as long as the computer is left alone.
- The behaviour is new, or at least newly noticed. It is worth asking when it started, because the answer points at the layer responsible — after a driver update, after a new program was installed, or after a browser setting was changed.
- The computer is a desktop running Windows. A laptop adds a second question — which graphics processor the number belongs to — and that boundary is covered below.
Several nearby behaviours look similar but are not this problem. Opening a program, moving a window, or starting a video will push usage up briefly; a short spike during ordinary use is normal, and only a sustained high reading counts as a symptom. High usage during a game or a render is also normal — the card is doing the work it was asked to do. A fan or a light that stays on after the computer has been shut down belongs to a different guide about standby power and ErP settings, not this one. And a computer that crashes or goes black at idle is a different problem again, about power-state switching, covered in a separate guide. This guide is about a card that is working hard, has not crashed, and should not be working hard.
Why does the distinction between "working hard" and "broken" matter so much? Because usage is a measure of work, not a measure of health. A card at 100% usage is a card being asked to do a lot, and the question that matters is who is asking. The seven steps below are built to answer exactly that question, one program at a time.
A note on the structure of this guide: the five suspicion layers, the seven steps, and the six misconceptions are the whole structure. Every section below refers back to them, and the numbers stay the same throughout — five layers, seven steps, six misconceptions — so that a result at any step can be traced back to the layer it tests.
Why the Percentage Can Mislead: Two Mechanisms to Understand First
Before opening Task Manager, two mechanisms need to be understood, because without them the numbers on screen will be read wrongly. Both are counter-intuitive, and both are the reason this guide exists.
The percentage changes with clock speed
The "GPU" column in Task Manager shows how busy the graphics card is at the moment of sampling. It is a ratio: how much work is being done, divided by how fast the card is currently running. That denominator is not fixed. At idle, a graphics card drops into a low power state — a low P-State — running at a low clock speed to save power. The same light piece of work shows a higher percentage at a low clock speed and a lower percentage at a high clock speed, because the card has less speed available to do it with.
That means "30% usage" on its own cannot be read as "heavy work". A light job on a card idling at a low clock can show a high percentage, while the same job on a card running at full clock shows a low one. The percentage only becomes meaningful when it is read together with four other readings: clock speed, temperature, fan speed, and power draw. A high percentage with a low clock, a low temperature, and low power draw is a different situation from a high percentage with a high clock, a high temperature, and fans at full speed. The first may be a light job exaggerated by a low clock; the second is real sustained work. Record all four readings in Step 1, not the percentage alone.
This is the first counter-intuitive point in the guide: a high percentage does not automatically mean heavy work. It means work relative to the speed the card is currently running at.
Desktop Window Manager takes the blame for other programs
The second mechanism concerns Desktop Window Manager, the system process shown as dwm.exe. Windows does not let each program draw directly onto the screen. Instead, every program draws its own window and hands it to Desktop Window Manager, which combines all the windows into one complete picture and hands that picture to the graphics card. Desktop Window Manager is the composer, not the author.
That matters because when dwm.exe shows high graphics usage, the work usually does not belong to Desktop Window Manager itself. It belongs to a program underneath it — a browser tab with an animated advert, a chat application redrawing its interface, a streaming application, a live wallpaper — that keeps asking for its window to be redrawn, over and over. Desktop Window Manager simply does the compositing it is asked to do. Close the program underneath, and the Desktop Window Manager number falls immediately.
This is the second counter-intuitive point: the process at the top of the list is often not the culprit. It is the process doing work on behalf of something else, and the diagnosis has to look one level down.
The Five Suspicion Layers
High idle usage can come from five layers, and they must be kept separate. Mixing them together is how a browser tab gets blamed on a faulty card, or a driver problem gets treated with an antivirus scan, and how a real culprit survives because the wrong layer was treated.
Layer One: The Program Layer — Which Program Is Using the Card
The first layer is the simplest: some program is using the graphics card. Task Manager, sorted by the GPU column, shows which program is at the top. The deciding test is whether a program that is neither a game nor a creative application is holding usage for a long time — a browser, a chat application, a game launcher, a video player, or a program running in the system tray that was forgotten about.
The comparison test for this layer is direct: close the program at the top of the list, and watch whether usage falls immediately. If it does, the culprit has been found. If it does not, move to the next program on the list. This layer is where most idle-usage problems are found, and it is also the cheapest to test, which is why it comes first.
A background program can also be one that was never deliberately opened. Game launchers, chat applications, and cloud storage tools often start with Windows and sit in the background, and a browser left open with many tabs is effectively many programs at once. Each tab can ask the graphics card for work, and the total adds up.
Layer Two: The Compositing Layer — Desktop Window Manager Drawing for Others
If the program at the top of the list is dwm.exe, the diagnosis moves to this layer. Desktop Window Manager itself rarely does heavy work for no reason; it does heavy work because a program below it keeps asking for redraws. The deciding test is to close the programs listed below Desktop Window Manager one at a time, watching the Desktop Window Manager number after each one. Whichever program makes the number fall is the real culprit.
This layer is easy to get wrong, because the natural reaction is to blame the process with the highest number. But a high Desktop Window Manager reading is a symptom of a program underneath it, in the same way that a busy waiter is a symptom of a busy kitchen. Treating Desktop Window Manager itself — trying to stop it, or reinstalling something to "fix" it — misses the program that is actually generating the work. Windows will restart Desktop Window Manager immediately if it is stopped, and stopping system compositing can leave the display in a broken state, so that path should never be tried.
Layer Three: The Settings Layer — Hardware Acceleration and Multiple Screens
The third layer is settings. Hardware acceleration in a browser, a chat application, or a streaming application hands rendering work to the graphics card instead of the processor. That is a normal, intended function, and it is not a fault in itself. But it does mean that a browser tab or a chat window can keep the graphics card busy even when nothing seems to be happening on screen, because the application is rendering in the background.
Multiple screens, a high refresh rate, and high DPI scaling add to the same effect: Desktop Window Manager has more compositing work to do, permanently, because there is more screen to compose and more frames to produce. A computer with two or three screens will show higher idle usage than the same computer with one screen, by design, and that difference is not a fault.
The deciding test for this layer is a comparison, one change at a time: turn hardware acceleration off in one application and watch the number, or disconnect the second screen and watch the number. The point of the test is the comparison, not the setting. Hardware acceleration is not "always bad" — it is a normal feature, used here only as a way to test whether it is the source of the work.
Layer Four: The Driver Layer — Driver Version and Leftover Settings
The fourth layer is the driver. When a driver has a problem, Desktop Window Manager can be forced to redraw repeatedly, keeping usage high for no visible reason. The deciding test is timing: did the problem appear after a driver update? A real-world case reported in Microsoft's own support community describes exactly this — idle usage spiking to 100% with the mouse freezing briefly, confirmed as a Desktop Window Manager issue, and resolved by going back to an earlier driver version, while the newer version caused the problem and a fresh Windows install with the newest driver brought it straight back. That case proves the point: a driver version on its own can be the culprit, and the version matters as much as the installation.
The option at this layer is a clean installation of the driver — installing fresh rather than over the top of the old one. The detailed steps for a clean driver removal belong to the dedicated driver guides, and this guide does not repeat them; it only names the option and points at it. What matters here is the comparison: if the problem started with a driver change, the driver is a suspect, and a clean install is the test.
Layer Five: The Malicious Program Layer — A Disguised Process
The fifth layer is a malicious program, such as miner malware that uses the graphics card to mine cryptocurrency in the background. Such programs often disguise themselves with the name of a system process — a fake dwm.exe, for example — so that they blend into the process list.
This layer has a strict rule: three conditions must all be met before anything can be described as suspected malware, and meeting only one of them is not enough. The three conditions are: first, the process's file is located somewhere other than `C:\Windows\System32`, which is where the genuine system process lives; second, usage is high from the moment the computer starts, and stays high even after every application has been closed; and third, a Safe Mode comparison shows usage falling back — Safe Mode loads only basic drivers and essential services, so a fall there points at something loading with normal startup.
Only when all three conditions are true should the conclusion be "suspected malicious program — run an antivirus scan". A single suspicious sign, on its own, proves nothing: a genuine system process can show high usage for the reasons in the earlier layers, and a scan run before the first four layers have been checked wastes time and can give a false sense of security.
Taken together, the five layers give the diagnosis its shape. The program layer asks which application is using the card. The compositing layer asks whether Desktop Window Manager is working on behalf of something else. The settings layer asks whether hardware acceleration or extra screens are generating the work. The driver layer asks whether a driver change is behind it. And the malicious program layer asks whether something is hiding behind a system process name — with three conditions that must all be met before that conclusion is drawn.
The Seven Diagnostic Steps
Work through these steps in order, and change only one thing at a time. The order is part of the diagnosis: the cheap, decisive tests come first, and the heavier tests come only after the cheap ones have ruled out their layers. Before any step that involves changing settings or restarting, note down the readings from Step 1, so that every later result can be compared against them.
Step 1: Confirm the Shape of the Symptom
First, establish whether the computer is at idle with nothing open, or whether the high usage appears while the computer is being used. Then record four readings: usage percentage, temperature, clock speed, and fan speed. A single percentage on its own is not enough, for the clock-speed reason explained above — a high percentage at a low clock with a low temperature is a different situation from the same percentage at a high clock with a high temperature.
Also note when the behaviour started, and what changed just before it: a driver update, a new program, a browser setting, a new screen. That note is the thread that connects the symptom to its layer, and it is also what will be brought to an in-store inspection if the diagnosis ends at the stop line.
Step 2: Open Task Manager and Sort by the GPU Column
Open Task Manager, go to the Processes tab, and sort by the GPU column so the heaviest user is at the top. Write down the top three programs and their numbers. Do not act on a single glance: watch for a minute or two, because a brief spike from opening Task Manager itself, or from a program starting up, will settle on its own.
The top three, not just the top one, matter, because the culprit is sometimes second or third — or, if the top entry is Desktop Window Manager, the culprit is hiding below it. This list is the map for the next two steps.
Step 3: Close the Top Program, One at a Time
Close the program at the top of the list, and watch the usage number. Then close the next one, and watch again. Each closure is its own test: if usage falls immediately after one particular program is closed, that program is the culprit. If usage stays high after the top three have all been closed, the cause is not in the program layer, and the diagnosis moves on.
Close one program at a time, not several at once. Closing three programs together and watching usage fall proves nothing about which of the three was responsible, and the next time the problem appears there will be no record of which program mattered.
Step 4: If the Top Entry Is dwm.exe, Close the Programs Below It
If the top entry is Desktop Window Manager, do not try to close or stop it. Instead, close the programs listed below it one at a time, watching the Desktop Window Manager number after each closure. Whichever program makes that number fall is the one generating the work that Desktop Window Manager is compositing.
This step is the practical application of the compositing mechanism: the process with the highest number is doing work on behalf of something else, and the test finds the something else. Browser tabs are a common answer here — close tabs one at a time, or close the browser entirely, and watch the number — but chat applications, streaming software, and animated content can all be the program underneath.
Step 5: Turn Off Hardware Acceleration, One Application at a Time, and Test the Second Screen
Turn off hardware acceleration in the browser, then in the chat application, then in the streaming application, testing the usage number after each change. Then, if a second screen is connected, disconnect it and watch the number again. Each change is a separate comparison, and the result of each one is recorded before the next change is made.
The purpose of this step is comparison, not permanent change. Hardware acceleration is a normal feature, and turning it off everywhere is not a fix — it is a test. If turning it off in one application makes usage fall, that application was generating the work. If disconnecting the second screen makes usage fall, the extra compositing work of the second screen was the cause, and the higher idle usage with two screens is normal behaviour, not a fault.
Step 6: The Safe Mode Comparison
Restart into Safe Mode and observe the usage number there. Safe Mode loads only basic drivers and essential services, so it strips away almost everything that loads at normal startup. The result divides the diagnosis in two:
- If usage falls back in Safe Mode, the cause is in the software layer — a program, a setting, or a driver that loads at normal startup but not in Safe Mode. The search returns to the earlier layers with that knowledge.
- If usage stays high in Safe Mode, the cause is in the driver or system layer. Do not jump from this result to "the hardware is faulty" — Safe Mode still uses a basic display driver, and a driver or system problem can keep usage high there too. This result narrows the field; it does not end the diagnosis.
Safe Mode is a comparison, not a treatment. Nothing should be changed permanently while in Safe Mode; the point is only to see which side of the divide the problem falls on.
Step 7: The Stop Line — Scan, or Bring It In
If the three comparisons above have all been done — programs closed one at a time, Desktop Window Manager's underlying programs tested, hardware acceleration and the second screen tested, and the Safe Mode comparison done — and no culprit has been found, or if a process's file location looks suspicious under the three conditions in Layer Five, then consider an antivirus scan, or bring the machine in for inspection.
Do not try to disable Desktop Window Manager. Windows will restart it immediately, and stopping system compositing can leave the display in a broken state. Do not keep closing programs at random, and do not reinstall the operating system on a guess. At this point the useful evidence is the record kept along the way: the four readings from Step 1, the top three programs from Step 2, which closure made the number fall (if any), and the Safe Mode result. That record is what an in-store inspection starts from.
A Quick Comparison: The Seven Diagnostic Steps at a Glance
| Step | What to do | What it tests | What the result means |
|---|---|---|---|
| 1. Confirm the symptom shape | Record usage, temperature, clock speed, fan speed at idle; note when it started | Whether this is sustained idle usage or a brief spike | A brief spike is normal; sustained high usage with all four readings recorded is the symptom |
| 2. Sort Task Manager by GPU | Write down the top three programs and their numbers | Which program is using the card | The top entry names the suspect — or, if it is dwm.exe, points one layer down |
| 3. Close the top program | Close one program at a time, watching usage after each | The program layer | Usage falling after one closure identifies the culprit |
| 4. If the top entry is dwm.exe | Close the programs below it one at a time | The compositing layer | Whichever closure drops the dwm.exe number is the real culprit |
| 5. Hardware acceleration and second screen | Turn off acceleration per application; disconnect the second screen | The settings layer | A fall after one change shows that setting was generating the work |
| 6. Safe Mode comparison | Observe usage in Safe Mode | Software layer versus driver or system layer | A fall points at software; staying high points at the driver or system layer |
| 7. Stop line | Antivirus scan if all three malware conditions are met, or bring the machine in | Whether the problem is beyond home diagnosis | No culprit found, or a suspicious file location, means stop and get inspection |
Boundaries: Problems That Look Similar but Are Not This One
A diagnosis is only as good as its boundaries. Several nearby problems share high usage, a loud fan, or a busy Desktop Window Manager, but each belongs to a different guide, and the steps above will not fix them:
- Multiple screens keep idle usage higher than a single screen. The extra compositing work is normal by design, and it should not be treated as a fault to be fixed. A separate guide covers multi-screen idle power in detail; this guide uses only the principle that a second screen raises idle usage.
- A laptop shows high usage on the wrong graphics processor. Task Manager lists the integrated graphics and the discrete graphics separately, and the number must be read against the right one. Mistaking an integrated graphics reading for a discrete card problem sends the diagnosis down the wrong road entirely.
- Brief spikes are not a symptom. Usage jumping for a second when a program opens, a window moves, or a video starts is normal. Only usage that stays high for minutes, with nothing open, counts.
- The fan or a light stays on after the computer has been shut down. That is a standby power and ErP settings problem, not an idle usage problem, and it belongs to a different guide.
- The computer crashes or goes black at idle. That is a power-state switching problem, covered in a separate guide about idle crashes. This guide covers a card that is working hard and has not crashed.
- The driver version is suspected, but the detailed clean-install procedure is needed. This guide names the clean-install option; the step-by-step procedure belongs to the dedicated driver guides, which should be followed rather than improvised here.
The principle is to isolate one thing at a time. A number that falls when one program closes, or when one setting changes, or when Safe Mode loads, is evidence — and the evidence points in different directions depending on when it falls. The seven steps are arranged so that each result narrows the field, and the note kept along the way is what turns a noisy fan into a diagnosis someone else can continue.
Six Common Misconceptions
Misconception 1: "Usage at 100% means the card is broken."
No. Usage is a measure of work, not a measure of health. A card at 100% is a card being asked to do a lot, and the first question is always who is asking. A browser tab, a chat application, or a disguised background program can all hold usage high while the card itself is perfectly sound. Start with the program list, not with the assumption of a fault.
Misconception 2: "dwm.exe using a lot of GPU means dwm.exe is broken."
No. Desktop Window Manager is the composer: it combines the windows that other programs draw. A high dwm.exe number usually means a program underneath it keeps asking for redraws. Close the programs below it one at a time and watch the number — the one that makes it fall is the culprit. Blaming the composer misses the program generating the work.
Misconception 3: "Turning off hardware acceleration will always fix it."
No. Hardware acceleration is a normal feature that hands rendering work to the graphics card, and turning it off is a comparison test, not a universal fix. If the problem is in the driver layer or the program layer, turning off acceleration changes nothing. Use it to test one application at a time, and judge by whether the number falls — not by the idea that acceleration itself is the problem.
Misconception 4: "A high percentage means heavy work is being done."
No. The percentage is work divided by the speed the card is currently running at, and at idle the card runs at a low clock speed to save power. A light job can show a high percentage at a low clock, while the same job shows a low percentage at a high clock. Read the percentage together with clock speed, temperature, fan speed, and power draw before deciding how much work is really being done.
Misconception 5: "One antivirus scan will solve it."
No. A scan is only one step in the fifth layer, and the first four layers have to be checked first. Scanning before the program layer, the compositing layer, the settings layer, and the driver layer have been tested wastes time, and a clean scan result can give a false sense of security while the real culprit — usually an ordinary program — keeps running. A scan is warranted only when all three malware conditions are met, or when the earlier layers have all been ruled out.
Misconception 6: "Disabling dwm.exe will stop the problem."
No. Windows will restart Desktop Window Manager immediately, because the system needs it to compose the screen. Trying to disable it does not stop the work; it only breaks the display, and the underlying program keeps asking for redraws anyway. The fix is to find the program underneath, not to attack the system process doing the compositing.
When to Stop and Bring the Machine In
Idle usage problems are usually found early — often at Step 3, where closing one program makes the number fall, or at Step 4, where closing a program below Desktop Window Manager makes its number fall. If all seven steps have been worked through, one variable at a time, and the problem is still present — or if a process meets all three malware conditions, with a file outside `C:\Windows\System32`, high usage from startup with everything closed, and a Safe Mode result that points at it — stop. Further guessing risks changing things that were never part of the problem, and a scan run on a guess is not a diagnosis.
Bring the machine in with the notes from Step 1 and the results of each step tried: the four readings, the top three programs, which closure changed the number, the Safe Mode result, and the file location if one looked suspicious. In-store inspection takes place at Room 1209, Dali Plaza, Shek Mun. You can call 2186 8010, or reach the shop on WhatsApp at 6558 6806. Inspection is charged at the site's published three-tier fees of HK$400–2,800, quoted after inspection. There is no home-visit service and no Mong Kok shop; inspection is carried out in the shop.
One last point about expectations: a diagnosis that ends at the stop line is not a failed diagnosis. A note that says "idle usage high with nothing open; top program is dwm.exe; closing the browser drops it; Safe Mode normal" is a precise description of where the fault lives, and it is exactly what an in-store inspection needs to start from the right place instead of from the beginning.
FAQ
Q1: Usage is at 100% while the computer is idle. Does that mean the graphics card is broken?
No. Usage is a measure of work, not a measure of health. A card at 100% is a card being asked to do a lot, and the first question is always who is asking. A browser tab, a chat application, or a background program can hold usage high while the card itself is perfectly sound. Start with the program list in Task Manager, not with the assumption of a fault.
Q2: dwm.exe is using a lot of GPU. Does that mean Desktop Window Manager is broken?
No. Desktop Window Manager combines the windows that other programs draw, so a high dwm.exe number usually means a program underneath it keeps asking for redraws. Close the programs listed below it one at a time and watch the number — whichever program makes it fall is the real culprit. Blaming the composer misses the program generating the work.
Q3: Will turning off hardware acceleration always fix high idle usage?
No. Hardware acceleration is a normal feature, and turning it off is a comparison test, not a universal fix. Turn it off in one application at a time and judge by whether the usage number falls. If the problem is in the driver layer or the program layer, turning off acceleration changes nothing, and turning it off everywhere is not a solution.
Q4: A high percentage must mean heavy work is being done. Is that right?
No. The percentage is work divided by the speed the card is currently running at, and at idle the card runs at a low clock speed to save power. A light job can show a high percentage at a low clock and a low percentage at a high clock. Read the percentage together with clock speed, temperature, fan speed, and power draw before deciding how much work is really being done.
Q5: Will one antivirus scan solve high idle GPU usage?
No. A scan is only one step in the fifth layer, and the first four layers have to be checked first — the programs, the compositing layer, the settings, and the driver. Scanning before those layers have been tested wastes time, and a clean result can give a false sense of security while the real culprit, usually an ordinary program, keeps running. A scan is warranted only when all three malware conditions are met, or when the earlier layers have all been ruled out.
Q6: Can I just disable dwm.exe to stop the problem?
No, and do not try. Windows will restart Desktop Window Manager immediately, because the system needs it to compose the screen. Disabling it does not stop the work — it breaks the display, while the program underneath keeps asking for redraws. The fix is to find the program below Desktop Window Manager, not to attack the system process doing the compositing.
Q7: How should the seven-step diagnosis be done, and what should I do first?
Step one is to confirm the shape of the symptom and record four readings — usage, temperature, clock speed, and fan speed — plus when the behaviour started. Step two is to sort Task Manager by the GPU column and write down the top three programs. After that, close the top program one at a time, test the programs below dwm.exe if it is at the top, turn off hardware acceleration one application at a time, test the second screen, and run the Safe Mode comparison. Change only one thing at a time, and record each result.
Q8: How can I tell whether the cause is miner malware rather than an ordinary program?
Three conditions must all be met before anything can be described as suspected malware: the process's file is located somewhere other than `C:\Windows\System32`; usage is high from the moment the computer starts and stays high even after every application has been closed; and a Safe Mode comparison shows usage falling back. Meeting only one of the three is not enough. Only when all three are true should the conclusion be "suspected malicious program — run an antivirus scan".
Q9: With multiple screens, or on a laptop, is high idle usage normal?
Possibly. Published guidance puts normal idle usage at roughly 0–3% or 1–5%, depending on the number of screens, the resolution, and the refresh rate, so it is not an absolute standard. Multiple screens make Desktop Window Manager do more compositing work permanently, so higher idle usage with two screens is normal by design — disconnecting the second screen confirms it. On a laptop, check whether the reading belongs to the discrete graphics or the integrated graphics, and do not mistake an integrated graphics reading for a discrete card problem.
Q10: When should I stop trying things myself and bring the machine in for inspection?
Stop when all seven steps have been worked through, one variable at a time, and the problem is still present; or when a process meets all three malware conditions. Bring your notes: the four readings from Step 1, the top three programs from Step 2, which closure changed the number, and the Safe Mode result. In-store inspection is at Room 1209, Dali Plaza, Shek Mun, charged at the site's published three-tier fees of HK$400–2,800, quoted after inspection. You can call 2186 8010 or WhatsApp 6558 6806.